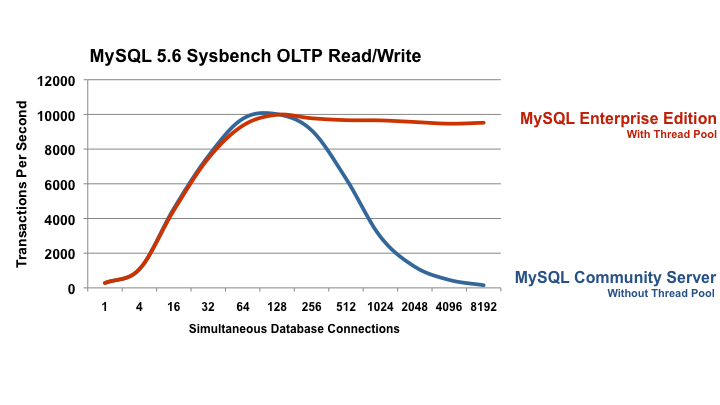
The graphs showing throughput with and without the thread pool are taken from the benchmark performed by Oracle and taken from here:
http://www.mysql.com/products/enterprise/scalability.html
The main take away is this graph (all rights reserved to Oracle, picture original URL):

Scalability is where throughput can grow and grow, as demand grows. I need to get more from the database, the question is: "can it scale to give it to me?". Scalability is where the response time remains "acceptable" while the throughput grows and grows.
Every database has a "knee point".
- In the best case scenario, in this knee-point, throughput will go into a flat plateau, and On the same point BTW, response time will start climbing, passing the non-acceptable point.
- In a worse case scenario, in this knee-point, throughput, instead of a flat plateau, it will take a plunger. On the same point BTW, response time will start climbing fast to the roof.
The thread pool feature is no more than a defense mechanism. It doesn't break the scalability limit of a single machine, rather its job is to defend the database from death.
Real scalability is when throughput graph is neither dropping or becoming flat - it goes up and up and up with a stable response time. This can be achieved only by Scale Out. Getting 7,500 TPS with 1 database with 32 connections, then add an additional database and the straight line going up will reach, say, 14,000. A system with 3 database can support 96 connections and 21,000 TPS... and on and on it goes...
Data needs to be distributed across those databases, so the load can be distributed as well. Maintaining this distributed data on the scaled-out database is the key... I'll touch that in future posts.
Why do the X-axis steps start out as power-of-2 increments but fall back to smaller increments after the 1024 mark? The decline of the blue line looks as if it goes down slower after that point while it actually gets stretched due to the x axis step change ...
ReplyDeleteAnd how does the red line do after the 4096 mark? Does it hold at around 7500tps forever? Seeing the x step trick above i start to wonder whether this deliberately ends at 4096 as the red line also starts to drop after that point ...
And yes, that was actually a question for Oracle, not so much you ...
ReplyDeleteThanks for your comments, I totally agree, you shouldn't mess up with the axis values like this...
ReplyDeleteBut - the takeaway is the same takeaway nonetheless.
As for the red line after 4,096 - I guess it holds there, why not? If the thread pool is doing its job, there are only 64 *active* threads, giving 6,500 TPS. All others are waiting in line... there can be 4,000 other threads or 10,000 other threads in this line... Still thread pool defends the db from dying, makes sure only 64 are active to provide the maximum throughput - 6,500 TPS.
Doron